1.The following table shows the ages of the patients admitted in a hospital during a year. 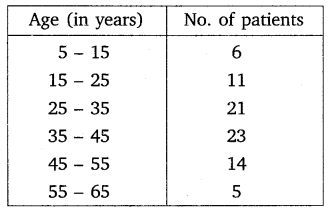
Find the mode and the mean of the data given above. Compare and interpret the two measures of central tendency.
Solution: 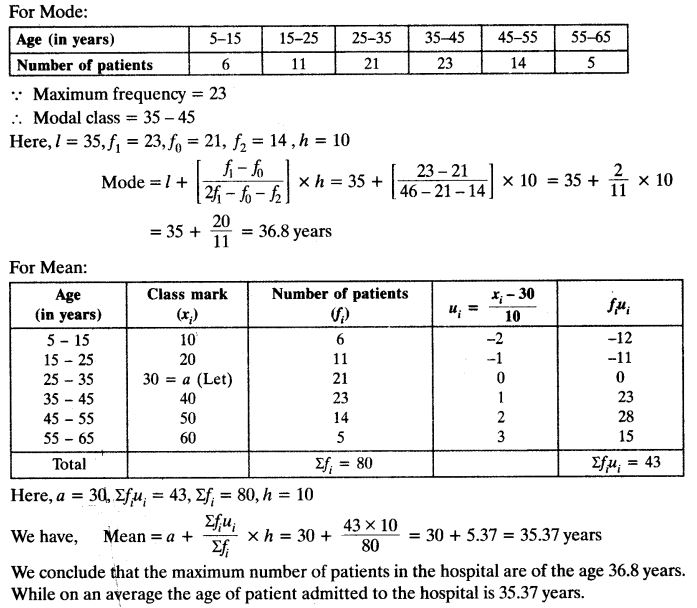
2.The following data gives information on the observed lifetimes (in hours) of 225 electrical components: 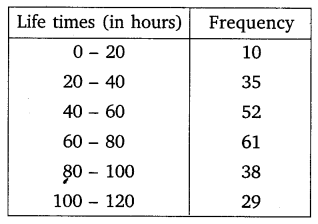
Determine the modal lifetimes of the components.
Solution: 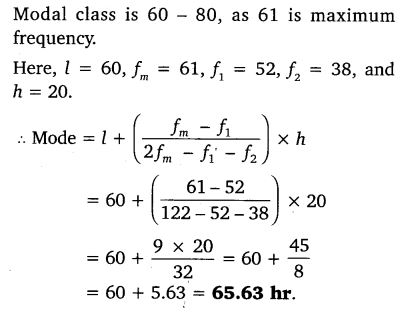
3.The following data gives the distribution of total monthly household expenditure of 200 families of a village. Find the modal monthly expenditure of the families. Also, find the mean monthly expenditure: 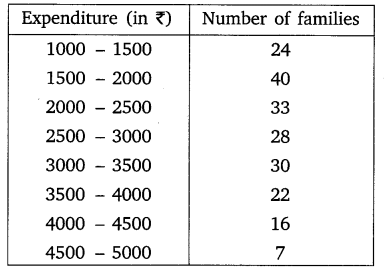
Solution: 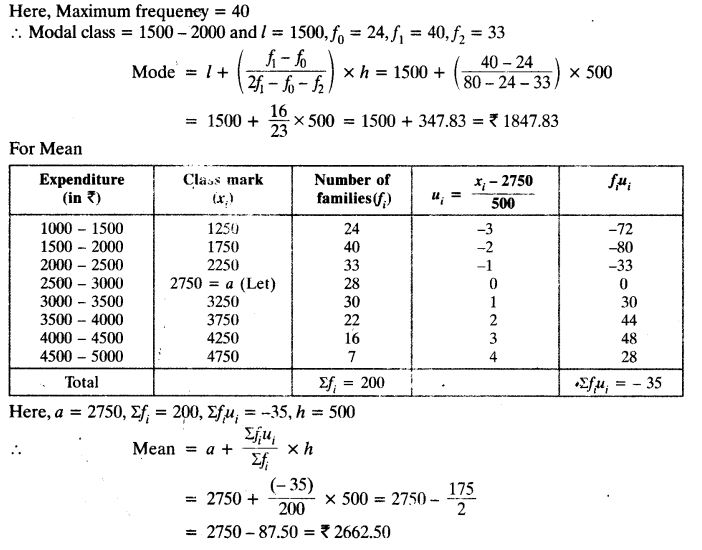
.
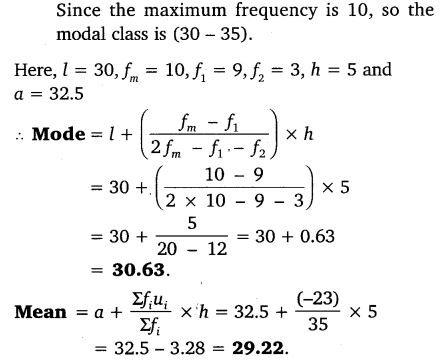
4.The following distribution gives the state-wise teacher- student ratio in higher secondary schools of India. Find the mode and mean of this data. Interpret the two measures. 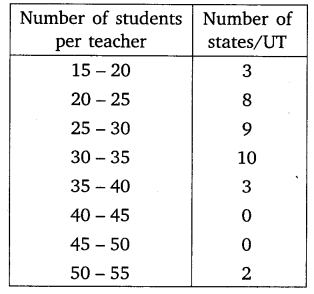
Solution: 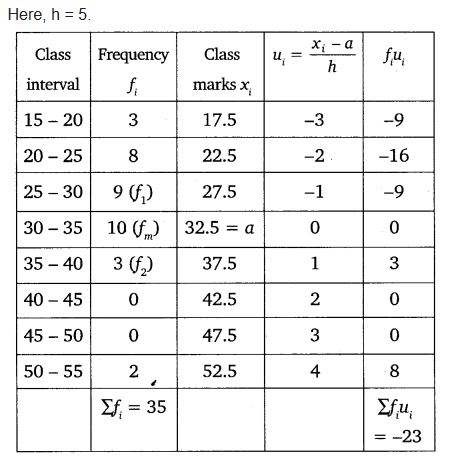
5.The given distribution shows the number of runs scored by some top batsmen of the world in one-day international cricket matches. 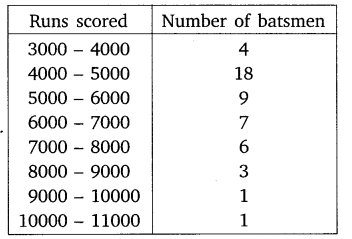
Find the mode of the data.
Solution: 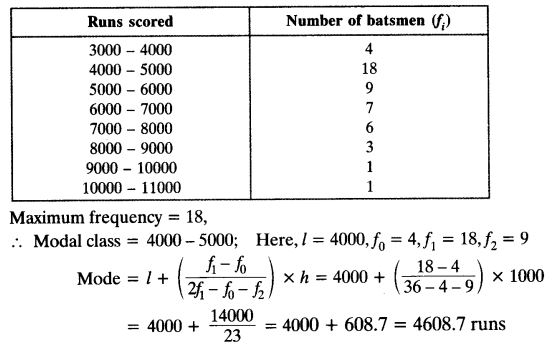
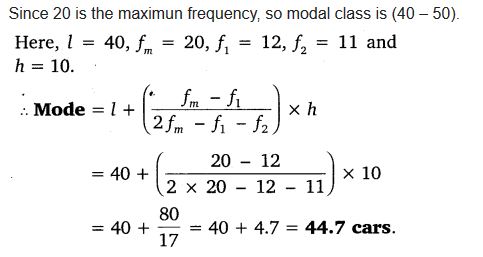
6.A student noted the number of cars passing through a spot on a road for 100 periods each of 3 minutes and summarised it in the table given below. Find the mode of the data: 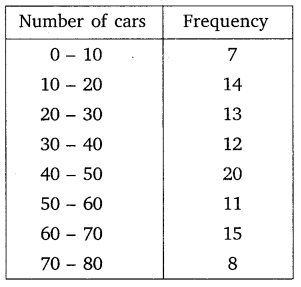
Solution: